Dashboard
Press 2 for the dashboard.
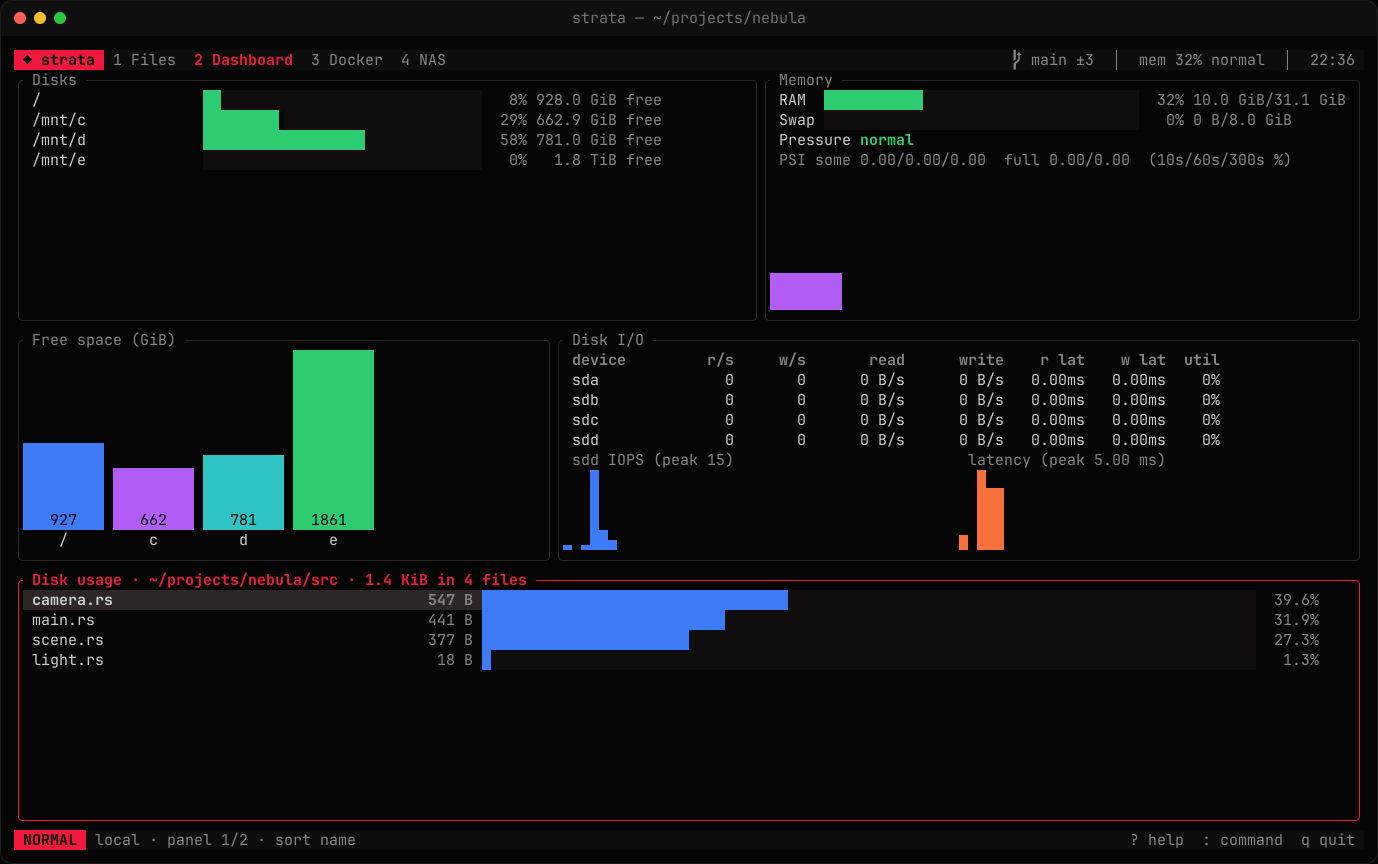
| Section | What it shows |
|---|---|
| Disks | Every mounted disk with used space, free space and whether it is a network or removable drive |
| Memory | RAM and swap usage, and memory pressure |
| Free space | A bar chart of free GiB per disk |
| Disk I/O | Per device: reads and writes per second, throughput, average latency and utilisation, with sparklines for the busiest device |
| Disk usage | The size of everything in the focused directory, largest first |
Use j / k in the disk-usage list. enter on a folder opens it in the disk usage view, where you can go further down. On a file, it shows the file in the files view.
Memory pressure
On Linux, strata reads pressure stall information (PSI): the share of time tasks wait for memory. That is a much better signal than "percent used", because a full page cache is healthy while stalls are not. Pressure is shown as normal, elevated, high or critical. Elsewhere it is estimated from free memory and swap.
I/O metrics
IOPS, latency and utilisation come from /proc/diskstats on Linux. Other platforms show read and write throughput.